
By using Portkey with Promptfoo you can:
- Manage, version, and collaborate on various prompts with Portkey and easily call them in Promptfoo
- Run Promptfoo on 1600+ LLMs, including locally or privately hosted LLMs
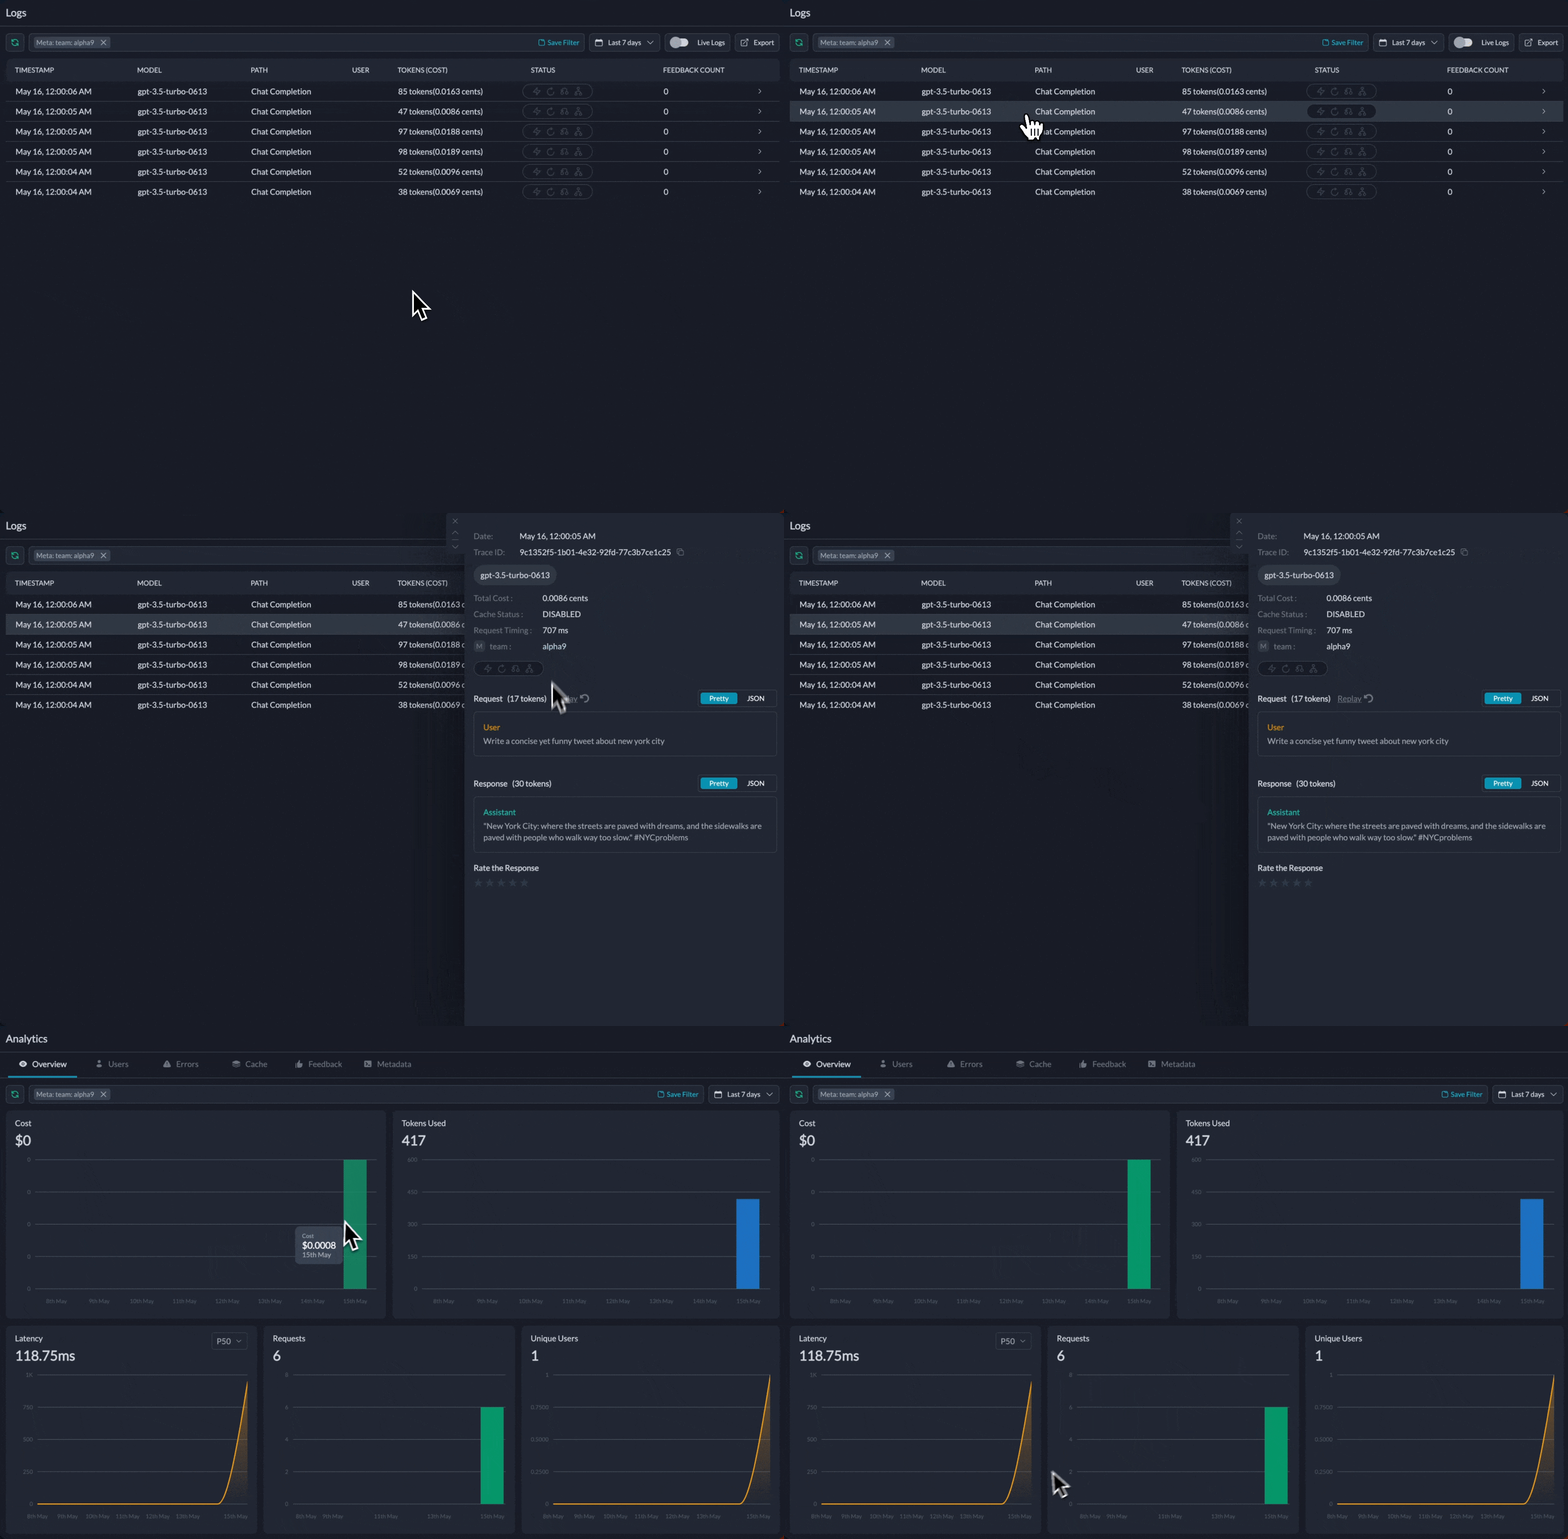
- Log all requests, segment them as needed with custom metadata, and get granular cost, performance metrics for all Promptfoo runs
- Avoid Promptfoo rate limits & leverage cache
1. Reference Prompts from Portkey in Promptfoo
- Set the
PORTKEY_API_KEYenvironment variable in your Promptfoo project - In your configuration YAML, use the
portkey://prefix for your prompts, followed by your Portkey prompt ID.
Note that promptfoo does not follow the temperature, model, and other parameters set in Portkey. You must set them in the providers configuration yourself.
2. Route to Anthropic, Google, Groq, and More
- Set the
PORTKEY_API_KEYenvironment variable - While adding the provider in your config YAML, set the model name with
portkeyprefix (likeportkey:gpt-4o) - And in the
configparam, set the relevant provider for the above chosen model withportkeyProvider(likeportkeyProvider:openai)
For Example, to Call OpenAI
Let’s now call Anthropic, Google, Groq, Ollama
- Anthropic
- Google Gemini
- Groq
- Ollama
Examples for Azure OpenAI, AWS Bedrock, Google Vertex AI
- Azure OpenAI
- AWS Bedrock
- Google Vertex AI
Using Virtual Keys
Without Using Virtual Keys
First, set theAZURE_OPENAI_API_KEY environment variable.Using Client Credentials (JSON Web Token)
You can generate a JSON web token for your client creds, and add it to theAZURE_OPENAI_API_KEY environment variable.3. Segment Requests, View Cost & Performance Metrics
Portkey automatically logs all the key details about your requests, including cost, tokens used, response time, request and response bodies, and more. Using Portkey, you can also send custom metadata with each of your requests to further segment your logs for better analytics. Similarly, you can also trace multiple requests to a single trace ID and filter or view them separately in Portkey logs.